
Tablet Content Uniformity: A Practical QC and Formulation Guide
- 7OHyea
- Aug 10
- 14 min read


Tablet content uniformity (CU) measures the API potency of each individual dosage unit by direct assay, confirming that every tablet in a batch delivers the intended dose within defined limits. Under USP <905> Uniformity of Dosage Units, CU is the required procedure whenever a product does not meet the conditions for weight variation, and FDA CPG Sec. 460.600 reinforces that non-official products with less than 50 mg API must have scientifically sound CU specifications. If your product triggers those conditions, the immediate steps are:
Confirm the test selection: verify whether your product qualifies for weight variation or requires CU based on dose, API proportion, and dosage form.
Pull a representative sample of 10 units from across the lot for the Stage 1 (L1) assessment.
Notify QA and regulatory affairs if the product is an NDA-listed item with a compendial monograph, since USP alignment is mandatory in that case.
Quarantine the batch pending CU results if there is any process deviation or blend homogeneity concern.
Key Takeaways
Tablet content uniformity requires individual-unit API assay under USP <905>, with AV compared against L1 (15.0) and L2 (25.0) defaults, and post-blend segregation is the most frequently overlooked root cause of CU failures.
Point | Details |
CU vs. weight variation trigger | CU is required when API dose is below 25 mg or below 25% of tablet weight; it may always be applied. |
L1 and L2 limits | Default L1 = 15.0 and L2 = 25.0; test 10 units first, then 30 if AV falls between the two limits. |
Segregation as root cause | Post-blend segregation during transfer and die filling causes CU failures even when blend homogeneity passes. |
Top preventive controls | Wet granulation, mass-flow hoppers, forced feeders, and NIR blend monitoring reduce CU risk at scale. |
7ohyea research materials | 7ohyea supplies third-party verified 7OH tablets in 15 mg, 30 mg, and 50 mg for low-dose analytical work. |
Table of Contents
What is tablet content uniformity, and when does it replace weight variation?
How do USP <905> acceptance criteria work: L1, L2, and Acceptance Value?
How to perform content uniformity testing: sampling, assay, and calculations
Why does content uniformity fail? Blend homogeneity versus dynamic segregation
OOS investigations and regulatory expectations when CU fails
Why segregation should be your first hypothesis when CU fails
What is tablet content uniformity, and when does it replace weight variation?
Content uniformity and weight variation both assess dosage consistency, but they measure fundamentally different things. Weight variation uses tablet mass as a proxy for API content, assuming the API is distributed homogeneously throughout the blend. CU bypasses that assumption entirely by assaying each unit individually for API potency, expressed as a percentage of the label claim.
USP <905> specifies that CU applies in most cases, and weight variation is permitted only under defined conditions involving minimum API proportion and dose thresholds. When either threshold is not met, CU is required. The chapter also notes that CU may be applied universally, meaning a laboratory can always choose CU even when weight variation would technically be permissible.
Several practical scenarios make the distinction concrete:
Small fluctuations in blend homogeneity or die filling translate directly into clinically meaningful potency differences that a weight check would never detect.
Multi-API tablets. When two or more active ingredients are present, each API below the proportion or dose threshold requires its own CU assessment. Weight variation covers none of them adequately.
Coated tablets and single-unit containers. Film-coated tablets where the coating contributes meaningfully to total weight, and products packaged as single-unit containers, are also subject to CU under the compendial framework.
FDA CPG Sec. 460.600 adds a compliance dimension: NDA holders whose products appear in USP monographs with CU requirements must align their testing accordingly. For non-official products, the FDA expects scientifically sound CU specifications that provide quality assurance equivalent to compendial criteria. Relying on weight variation for a demixing-prone formulation without documented justification is a regulatory risk, not just a technical one.
How do USP <905> acceptance criteria work: L1, L2, and Acceptance Value?
The decision flow in USP <905> operates in two stages, each governed by an Acceptance Value (AV) compared against limits.
The L1 and L2 decision flow
Stage 1 (L1): Assay 10 individual units. Calculate AV. If AV is within a defined acceptable threshold, the batch passes. If AV is above that threshold but within a higher threshold, proceed to Stage 2.
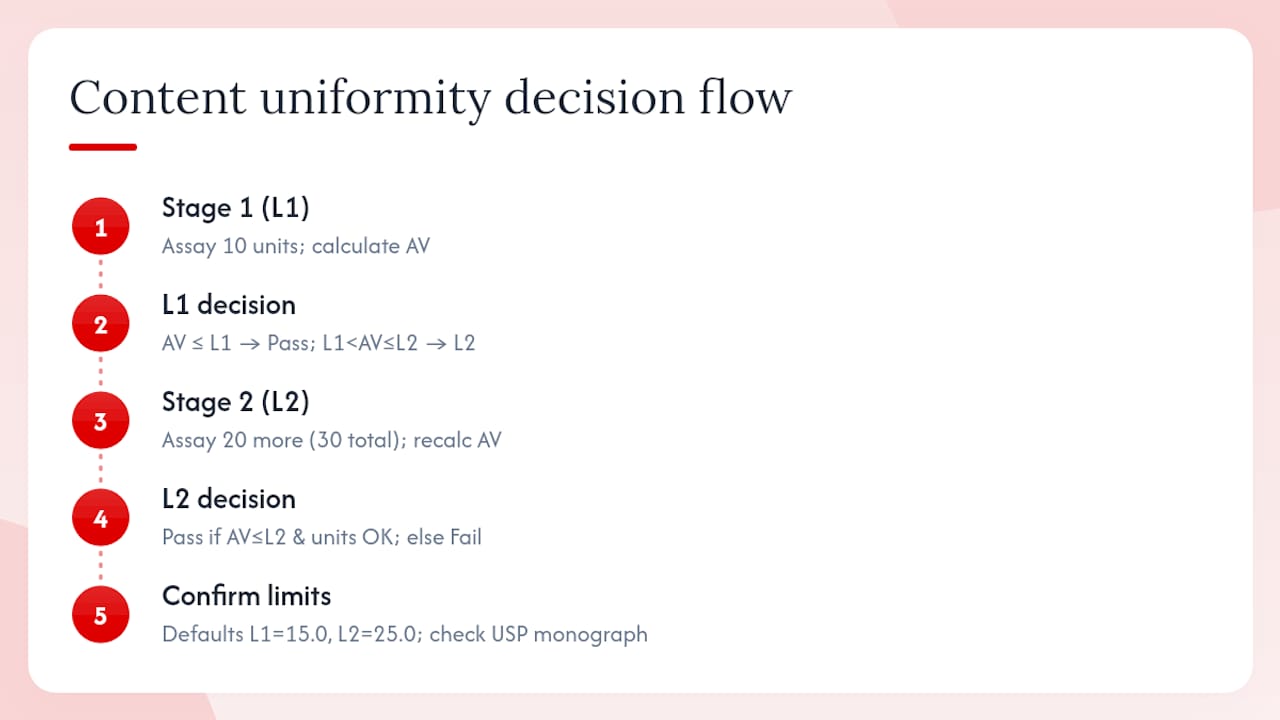
Stage 2 (L2): Assay an additional 20 units (30 total). Recalculate AV on all 30 results. The batch passes if AV is within the higher threshold and no individual unit falls outside an established acceptance range; otherwise, it fails.
Monograph-specific limits may differ from the defaults of L1 = 15.0 and L2 = 25.0, so always confirm against the current USP monograph before applying default values.
The Acceptance Value formula
The AV is calculated as:
AV = |M − X̄| + k·s
Where:
X̄ = mean of individual unit assay results (% label claim)
s = sample standard deviation of those results
k = acceptability constant (2.4 for n = 10; 2.0 for n = 30)
M = reference value, defined as the label claim (100%) when X̄ is between 98.5% and 101.5%; otherwise M equals X̄ itself, subject to the 98.5%–101.5% boundary
Worked example: 30-unit sample
In this example, the batch passes at Stage 1. Had the Stage 1 AV fallen between 15.0 and 25.0, the lab would proceed to Stage 2 with 20 additional units and recalculate using k = 2.0 across all 30 results.
How to perform content uniformity testing: sampling, assay, and calculations
A well-executed CU test depends on three things working together: a representative sample, a validated assay with adequate sensitivity, and complete documentation. Cutting corners on any one of them creates both analytical and regulatory exposure.
Step-by-step testing procedure
Define the sampling plan. Select units randomly from across the entire lot, drawing from the beginning, middle, and end of the compression run. For large batches, stratified random sampling across multiple drum or container positions is standard practice. Document the sampling locations and times in the chain-of-custody record before any analysis begins.
Prepare individual unit assays. Each tablet is assayed separately. Weigh the unit, dissolve or extract it using the validated procedure, and dilute to the working concentration. Never pool units for a composite assay in CU testing — the entire purpose is individual-unit potency.
Select and run the analytical method. HPLC-UV is the workhorse for most CU assays: it offers adequate sensitivity for APIs present at milligram levels, is well understood by regulators, and is straightforward to validate. LC-MS/MS becomes necessary when the API is present at microgram levels, when matrix interferences are significant, or when selectivity for a metabolite or degradant is required. Titrimetry is acceptable only for high-dose, chemically simple APIs where selectivity is not a concern.
Calculate % label claim per unit. For each unit: % LC = (Assay result / Label claim) × 100. Record all individual values before computing any summary statistics.
Compute AV. Calculate X̄ and s across the 10 (or 30) individual results, determine M, apply the appropriate k, and compare AV to L1 or L2 as described in the previous section.
Interpret and document. Record the pass/fail decision with the AV value, the applicable limit, and the stage reached.
Audit documentation checklist
Documentation item | What auditors verify |
Analytical method version and SOP reference | Current validated version was used |
Instrument calibration records | Calibration was current at time of analysis |
Reagent and standard lot numbers | Traceability of reference standards |
Dilution scheme and preparation records | Correct concentration range; no transcription errors |
Individual unit weights | Confirms units were within expected range before dissolution |
Raw chromatograms or instrument output | Data integrity; no manual integration anomalies |
Analyst initials and supervisor review | Two-person review completed |
AV calculation worksheet | Formula applied correctly; M determination documented |
What analytical validation does a CU assay require?
CU assays carry a higher validation burden than release assays run on pooled composites, because the method must perform reliably at the level of a single unit, not an average. For low-dose APIs, that distinction is significant.
Specificity must be demonstrated against all likely matrix components: excipients, degradants, and any co-formulated APIs. A specificity failure in a CU assay is particularly damaging because it cannot be averaged away across units.
Accuracy and recovery need to be established across the full range of expected individual-unit content, not just at the label claim. Spiked placebo recovery experiments at three concentration levels are the standard approach.
Precision (repeatability and intermediate precision) should be evaluated at the working concentration. For CU, intermediate precision matters more than in composite assays because different analysts and instruments will process different units from the same batch.
Limit of quantitation (LOQ) is the parameter most often underestimated for low-dose products. The LOQ must be well below the lowest expected individual-unit content, with a signal-to-noise ratio of at least 10:1 confirmed during validation. For APIs below 25 mg per unit, demonstrating adequate LOQ is a regulatory expectation, not optional.
Linearity across the working range and robustness to minor method variations (column lot, pH, temperature) round out the core validation package. Robustness data are particularly useful during OOS investigations, when you need to rule out method variability as a contributing factor quickly.
When HPLC-UV cannot achieve the required LOQ or selectivity, LC-MS/MS is the appropriate upgrade. The tradeoff is a more complex validation package, including matrix-matched calibration and ionization suppression assessment. Titrimetry remains acceptable for APIs above roughly 100 mg per unit where selectivity is not in question, but it has no role in low-dose CU work.
Why does content uniformity fail? Blend homogeneity versus dynamic segregation
A CU failure does not automatically mean the blend was poorly mixed. This distinction, emphasized by Jakubowska and Ciepluch in their 2021 review, changes how you investigate and what you fix.
Post-blend segregation during powder transfer, hopper discharge, and die filling is a frequent root cause of final tablet CU failures, and it can occur even when the initial blend assays as homogeneous. The mechanisms differ: fine API particles may percolate through coarser excipient particles during vibration or free-fall transfer; density differences drive stratification in hoppers; and turbulent airflow in the feed frame can preferentially carry lighter particles to different die positions.
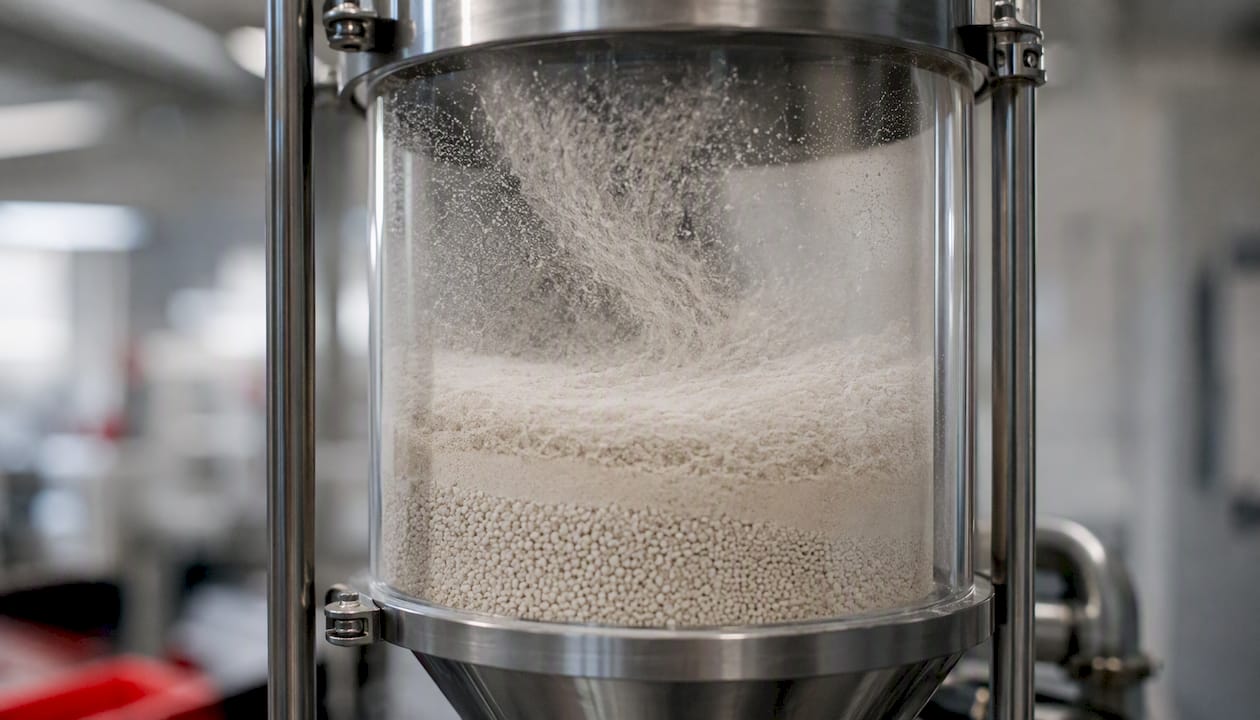
The data pattern tells you which problem you have. Segregation during a production run tends to produce trending potency: units from the beginning or end of the run are systematically high or low, and between-location variability (e.g., front vs. back of the press) is elevated. Poor initial blending, by contrast, produces random high RSD distributed across the entire run with no clear spatial or temporal trend.
A DoE-based process model can further clarify the contribution of press and feeder speed interactions to weight and content variability, helping teams identify operating sweet spots during scale-up rather than discovering problems at production scale.
Pro Tip: Plot individual unit assay results against production sequence number and tablet press station. A trending pattern across time points to dynamic segregation; a random scatter with high overall RSD points to blend homogeneity. Running both plots before any other investigation step saves significant time.
Formulation and process controls that reduce CU risk
Preventing CU failures requires coordinated decisions across formulation, equipment selection, and process parameters. No single lever is sufficient on its own.
Formulation levers:
Wet granulation consolidates API and excipients into granules, reducing the particle-size and density differences that drive segregation; it is the most reliable formulation-level control for segregation-prone APIs.
Dry granulation (roller compaction) offers a middle path when wet processing is incompatible with the API, improving flow and reducing fines without solvent exposure.
Particle-size distribution control for both API and excipients narrows the size gap that enables percolation segregation; milling or micronization of the API should be paired with matching excipient grades.
API surface coating or ordered mixing can anchor fine API particles to larger carrier excipients, reducing free-particle segregation during transfer.
Lubricant concentration and mixing time require careful optimization: over-lubrication reduces tablet hardness and can alter dissolution, while under-lubrication increases sticking and weight variability.
Process levers:
Feed-frame design and forced-feeder use maintain consistent die filling by keeping powder in continuous, controlled contact with the die table rather than relying on gravity alone.
Hopper geometry matters: mass-flow hoppers (steep walls, no ledges) promote uniform discharge and minimize the stratification that funnel-flow hoppers allow.
Minimizing free-fall distances and vertical powder transfers reduces the kinetic energy that drives segregation; short, enclosed transfer chutes are preferable to open drops.
Press speed and feeder speed must be matched to the blend’s flow characteristics. Process modeling research demonstrates that press/feeder speed interactions can be mapped using DoE to identify combinations that achieve tablet weight %RSD within acceptable bounds across different formulation flow classes.
Continuous manufacturing architectures, as noted in the Jakubowska and Ciepluch review, reduce intermediate powder transfers and allow inline monitoring, making them a structural mitigation for segregation risk.
In-process controls and PAT:
Near-infrared (NIR) or FT-NIR blend monitoring provides real-time homogeneity data before powder reaches the press, catching segregation events before they become tablet-level CU failures.
In-line weight monitoring with statistical process control (SPC) rules, such as Western Electric rules applied to individual tablet weights, detects drift in die filling before the AV calculation is even needed.
Automated vision systems for tablet appearance can flag physical anomalies that correlate with process upsets affecting content distribution.
OOS investigations and regulatory expectations when CU fails
When a CU result fails, the investigation must be systematic, documented, and completed before any batch disposition decision. Regulators expect a clear separation between the analytical investigation phase and the process investigation phase.
Regulatory framework. FDA CPG Sec. 460.600 establishes that CU testing requirements apply to tablets and capsules under specified conditions and that firms bear responsibility for setting scientifically sound specifications. USP <905> defines the acceptance criteria and the testing sequence. Together, they set the floor for what an investigation must address. Stakeholder harmonization discussions captured in the FDA-2013-S-0610 docket provide useful background on how these requirements have evolved.
Immediate containment. Quarantine the affected batch and any associated in-process materials. Preserve all retained samples, including blend samples if available, because they may be needed for confirmatory testing.
Phase 1: Analytical investigation. Before attributing the failure to a process cause, rule out laboratory error. Review the raw data for transcription errors, integration anomalies, and calibration status. Confirm that the method was run per the current validated SOP and that all reagents and standards were within their use-by dates. If a confirmed laboratory error is identified and documented, a single retest of the affected unit(s) may be justified; otherwise, proceed to Phase 2.
Phase 2: Process investigation. Generate root-cause hypotheses based on the data pattern. Trending potency across the run points to segregation during transfer or die filling. Random high variability points to blend homogeneity. Review batch records for deviations in blending time, feeder speed, press speed, and transfer conditions. Cross-check whether weight variation data (if collected in-process) shows corresponding trends.
CAPA planning. Document the root cause with supporting evidence, not just a hypothesis. Corrective actions must address the specific mechanism identified: a segregation root cause requires process or formulation changes, not just a repeat blend. Preventive actions should include a risk assessment of other products with similar formulation profiles.
Documentation for regulators. The investigation file should contain: the batch record review with deviation summary, sampling location evidence (where in the lot each unit came from), the method validation summary confirming the assay was fit for purpose, and a cross-check documenting whether weight variation could have been legitimately applied and why CU was the correct test.
Pre-release CU compliance checklist for QC and production
Run through this checklist before releasing any batch subject to CU requirements. Each item maps to a common audit finding or OOS root cause.
Test selection confirmed: Verify that CU (not weight variation) is the correct test for this product based on dose, API proportion, and monograph requirements. Document the decision rationale.
Sample integrity verified: Confirm that units were randomly selected from across the lot, that sampling locations were recorded, and that chain-of-custody documentation is complete from sampling through analysis.
Assay calibration current: Check that the analytical instrument was calibrated within its required interval and that the reference standard lot is within its use-by date and retest date.
LOQ confirmed adequate: Verify that the method LOQ is below the lowest expected individual-unit content for this product, particularly for low-dose APIs.
Trend charts reviewed: Plot individual unit assay results against production sequence and press station before computing AV. Flag any trending pattern for process investigation before proceeding to pass/fail.
Feeder and press speed records reviewed: Confirm that press and feeder speeds remained within validated ranges throughout the run. Deviations should trigger a targeted investigation before batch release.
AV calculation verified: Have a second analyst independently verify the AV calculation, including the M determination and k selection.
Pass/fail decision documented: Record the AV, the applicable L1 or L2 limit, the stage reached, and the final disposition decision with approver signature.
Escalation trigger: If AV falls between L1 and L2 at Stage 1, proceed immediately to Stage 2 testing.
Why segregation should be your first hypothesis when CU fails
The pharmaceutical industry’s default response to a CU failure is often to extend blend time or increase the number of blend samples. That reflex is understandable but frequently misses the actual problem.
Jakubowska and Ciepluch’s review makes a point that deserves more weight in routine QC practice: the distinction between initial blend homogeneity and dynamic segregation during downstream handling is not just academic. It changes the investigation priority, the corrective action, and the timeline for resolution. A batch that passes blend homogeneity testing and then fails CU at release is almost certainly a segregation problem, not a blending problem. Treating it as the latter wastes time and leaves the actual mechanism unaddressed.
Cross-functional incident reviews, bringing together formulation scientists, process engineers, and QC analysts in the same room with the same data, consistently resolve these cases faster than sequential handoffs between departments. The formulation scientist knows whether the API particle size is segregation-prone; the process engineer knows whether the transfer path changed at scale-up; the QC analyst has the trend data. None of them has the full picture alone.
The practical recommendation is to make rapid data visualization the first action in any CU investigation: plot unit assay vs. production sequence, overlay press station data, and share that plot across all three functions before any hypothesis is formally assigned. Small-scale segregation experiments, such as a vibration test or a simple hopper discharge study, can confirm or rule out the mechanism within days. For high-risk products, PAT investment in NIR blend monitoring pays back quickly in reduced investigation cycles and faster batch release.
Research-grade 7OH tablets with documented CU controls
Researchers working with potent alkaloids at low dose levels know that content uniformity is not a formality. A 15 mg or 30 mg tablet with poor CU is analytically unreliable, and unreliable reference material compromises every downstream result.
7ohyea supplies research-grade 7-hydroxymitragynine tablets manufactured with rigorous quality assurance and third-party laboratory verification, available in 15 mg, 30 mg, and 50 mg configurations to support diverse analytical protocols. Each product ships with a Certificate of Analysis confirming alkaloid content, and the 15 mg and 30 mg tablet SKUs are particularly relevant for researchers validating low-dose assay methods where LOQ and recovery are the critical parameters. Sourced and manufactured in British Columbia, these materials are designed for analytical use only, with labeling and documentation that reflects that status. For research teams that need consistent, well-characterized alkaloid formulations without the sourcing uncertainty of unverified suppliers, 7ohyea is the direct route. Visit the product page to review available SKUs and place an order.
Sources
These are the primary references a QC scientist should consult for formal language, criteria, and mechanistic detail.
USP <905> Uniformity of Dosage Units — The compendial standard for acceptance criteria, AV formula, L1/L2 defaults, and the 10/30 unit decision flow. Consult this first for any criteria question.
FDA CPG Sec. 460.600 — FDA’s compliance policy on CU testing applicability, NDA alignment requirements, and the standard for non-official products. Use this when setting specifications or responding to FDA observations.
Jakubowska & Ciepluch (2021), PMC8620778 — Peer-reviewed review of blend segregation mechanisms and their effect on tablet CU. The primary reference for segregation root-cause analysis and mitigation strategy selection.
Process Model for Tablet Weight Variability, MDPI Pharmaceutics 2021 — DoE-based process model for predicting weight variability across press types and identifying press/feeder speed sweet spots. Use this for scale-up risk assessment and process characterization.
USP/PDG Harmonization page — Background on harmonization updates to the uniformity chapter; useful for understanding how application rules have changed and for confirming current national text notes.
This article is general information, not a substitute for advice from a qualified doctor. Consult a qualified healthcare professional about your own circumstances before acting on anything here.
FAQ
What is content uniformity in tablets?
Content uniformity is the measure of API potency in each individual tablet, expressed as a percentage of the label claim, verified by direct assay of each unit separately. It confirms that every tablet in a batch delivers the intended dose within the limits defined by USP <905>.
What are L1 and L2 in content uniformity testing?
L1 (default 15.0) and L2 (default 25.0) are the two Acceptance Value limits in USP <905>.
How do you test tablet content uniformity?
Assay 10 individually selected units by a validated method (typically HPLC-UV or LC-MS/MS), calculate % label claim for each, then compute the Acceptance Value using the formula AV = |M − X̄| + k·s and compare it against the L1 limit; proceed to 30 units if needed.
What is the USP limit for content uniformity?
Monograph-specific limits may differ, so always verify against the current USP monograph for the product in question.
When is weight variation acceptable instead of content uniformity?
Even when weight variation is technically permissible, it is only valid if API distribution homogeneity has been demonstrated, since segregation-prone formulations can pass weight variation while failing CU.
Recommended
Comments