
Stability Indicating Methods: A Validated Lab Workflow
- 7OHyea
- Aug 9
- 16 min read


A stability-indicating method (SIM) is a validated quantitative analytical procedure that accurately measures active pharmaceutical ingredient (API) concentration over time without interference from degradation products, process impurities, or excipients. Per ICH’s definition, the method must separate and quantify the API independently, so any loss in potency reflects genuine chemical degradation rather than analytical artifact.
Before you write a single protocol, confirm these five actions are in place:
Review the governing guidance. Pull ICH Q1A(R2), Q1B, Q1E, Q2(R1/R2), Q3A/Q3B, and the relevant FDA guidance documents. These define every acceptance criterion you will need to justify.
Assemble a characterized reference batch. You need a batch with a known purity certificate and traceable reference standard before forced degradation begins.
Draft your forced-degradation stress matrix. Plan conditions across heat, humidity, oxidation, photolysis, and pH-driven hydrolysis before you touch the instrument.
Confirm instrumentation availability. At minimum, you need an HPLC or UPLC system with a diode-array detector (DAD). LC-MS access is required if you expect unknown degradants that need structural identification.
Map where the SIM sits in the dossier. SIMs appear in three places: the release assay, the stability-testing protocol, and the impurity-reporting section. Each placement carries different validation and reporting obligations.
A strength assay and a SIM are not the same thing. USP guidance is explicit: only a method that separates degradants from the API and meets full validation criteria can be used to establish beyond-use dates or shelf life. An HPLC assay that has never been challenged with degraded samples can mask API loss entirely.
Key Takeaways
A stability-indicating method is only as strong as its forced-degradation evidence: specificity demonstrated through peak-purity data and LC-MS degradant identification is the foundation every other validation parameter depends on.
Point | Details |
Forced degradation drives specificity | Run all seven stress conditions targeting 5–10% degradation; document every condition in a dedicated stress-study report. |
DAD peak purity is the primary proof | Confirm the API peak purity angle is below the threshold on stressed samples before finalizing any other validation experiment. |
LC-MS is required for degradant ID | Use LC-MS to assign molecular formulas and propose structures for any degradant exceeding ICH Q3A/B identification thresholds. |
ICH Q1E regression assigns shelf life | Calculate the 95% confidence interval of the regression line; test poolability with ANCOVA before combining batch data. |
Validation maps to ICH Q2(R2) | Document specificity, accuracy, precision, linearity, LOQ/LOD, range, and robustness per ICH Q2(R2) with forced-degradation evidence for specificity. |
Table of Contents
What regulators expect from stability indicating methods in a dossier
How to design a forced degradation study that generates meaningful degradants
Which analytical techniques work best as stability indicating assays?
How to develop a chromatographic method that is genuinely stability indicating
Validation experiments that prove a method is stability indicating
How to evaluate stability data and assign a shelf life using ICH Q1E
A worked example: from stress matrix to validated method and regulatory report
A practitioner’s perspective on what actually matters in SIM development
What regulators expect from stability indicating methods in a dossier
The regulatory framework for SIMs is built on a small set of interconnected ICH guidance documents, each covering a distinct piece of the development and validation puzzle.
ICH Q1A(R2) sets the stress-testing expectations that generate the degradants your method must resolve. Q1B extends those requirements to photostability. ICH Q1E defines the statistical approach for turning stability data into a shelf-life assignment. ICH Q2(R2) prescribes the validation characteristics — specificity, accuracy, precision, linearity, LOQ/LOD, range, and robustness — and explicitly requires forced-degradation evidence to establish specificity for a stability-indicating method. ICH Q3A and Q3B govern impurity identification thresholds and reporting obligations for drug substances and drug products, respectively.
On the U.S. side, FDA’s ANDA stability guidance aligns closely with ICH Q1A but adds submission-specific expectations for how assay methods and forced-degradation evidence are documented in the dossier. The FDA analytical procedures validation guidance further clarifies lifecycle management expectations, including how to handle method changes post-approval.
Pro Tip: Build a one-page guidance map at the start of every SIM project: list each ICH/FDA document, the section it governs, and the deliverable it requires. Reviewers and auditors will ask for this traceability, and having it ready saves weeks during dossier assembly.
Regulators require SIMs to demonstrate three things above all else: the method is specific (the API peak is free from interference), the method is quantitative (it accurately measures API across the expected degradation range), and the forced-degradation evidence is documented (you ran the stress matrix, generated the degradants, and showed the method resolves them). Stability reports, impurity identification packages, and shelf-life calculations all flow from this foundation. A method that cannot show clean specificity data from a stress study will not survive regulatory review, regardless of how well the routine precision and linearity data look.
How to design a forced degradation study that generates meaningful degradants
Forced degradation, also called stress testing, is the controlled chemical breakdown of your API under conditions more severe than normal storage. Its purpose is to generate the degradants your SIM must resolve, not to simulate real-world shelf life. The distinction matters: you are building a specificity challenge, not a stability prediction.
Stress conditions to include
ICH Q1A(R2) specifies the following conditions as the standard stress matrix:
Thermal stress. Apply heat in 10°C increments above the accelerated testing temperature. For most small molecules, 50°C, 60°C, and 70°C in a dry oven cover the range. Run open and closed containers separately to distinguish oxidative from thermal pathways.
Humidity stress. Expose samples at elevated relative humidity (typically 75% RH or higher) at elevated temperature. Use a humidity chamber with a calibrated sensor.
Oxidative stress. Treat solutions with hydrogen peroxide (commonly 3–30% w/v, depending on API sensitivity). This condition is particularly important for APIs with thioether, phenol, or indole functionality.
Photolytic stress. Follow ICH Q1B: expose samples to a minimum of 1.2 million lux-hours of visible light and 200 Wh/m² of near-UV energy. Run protected controls in parallel.
Acid hydrolysis. Treat solutions with dilute HCl (0.1–1 N) at room temperature or elevated temperature, with time points at 1, 4, and 24 hours.
Base hydrolysis. Mirror the acid condition using NaOH. Many APIs degrade faster under alkaline conditions, so start at 0.01 N before escalating.
Neutral aqueous hydrolysis. Dissolve the API in water at elevated temperature. This isolates hydrolytic pathways from pH-driven ones.
Target degradation range and design choices
Industry practice recommends targeting 5–10% degradation for most APIs. Staying in this range generates enough degradants to challenge the method without producing secondary products that complicate peak assignment. Degradation above approximately 20% can open atypical pathways, creating artifacts that will never appear on a real stability shelf.
Run each stress condition on a single representative batch first. If the API shows unusual sensitivity to one condition, a design of experiments (DoE) approach helps you map interacting degradation pathways without running every combination manually. Always include:
Unstressed control: same solvent and container, stored at room temperature, analyzed at the same time points.
Placebo (excipient blank): formulated product without API, stressed under identical conditions. This identifies excipient-derived peaks that could co-elute with API or degradants.
Solvent blank: to confirm no system or reagent peaks interfere.
Document every stress condition in a dedicated stress-study report: the exact reagent concentrations, temperatures, exposure times, sample preparation steps, and the chromatograms from each time point. This report becomes the primary specificity evidence in your validation package.
Which analytical techniques work best as stability indicating assays?
Chromatographic methods coupled with spectroscopic detectors are the dominant approach for SIMs. The combination of quantitative separation and qualitative identification is what makes them suitable for both the assay and the impurity-reporting obligations under ICH Q3A/Q3B.
HPLC or UPLC with DAD is the standard starting point for most small-molecule APIs. DAD provides UV spectral data at every point in the chromatogram, enabling peak-purity analysis — the primary tool for confirming that the API peak is not co-eluting with a degradant. UPLC offers faster run times and sharper peaks, which improves resolution of closely eluting degradants.
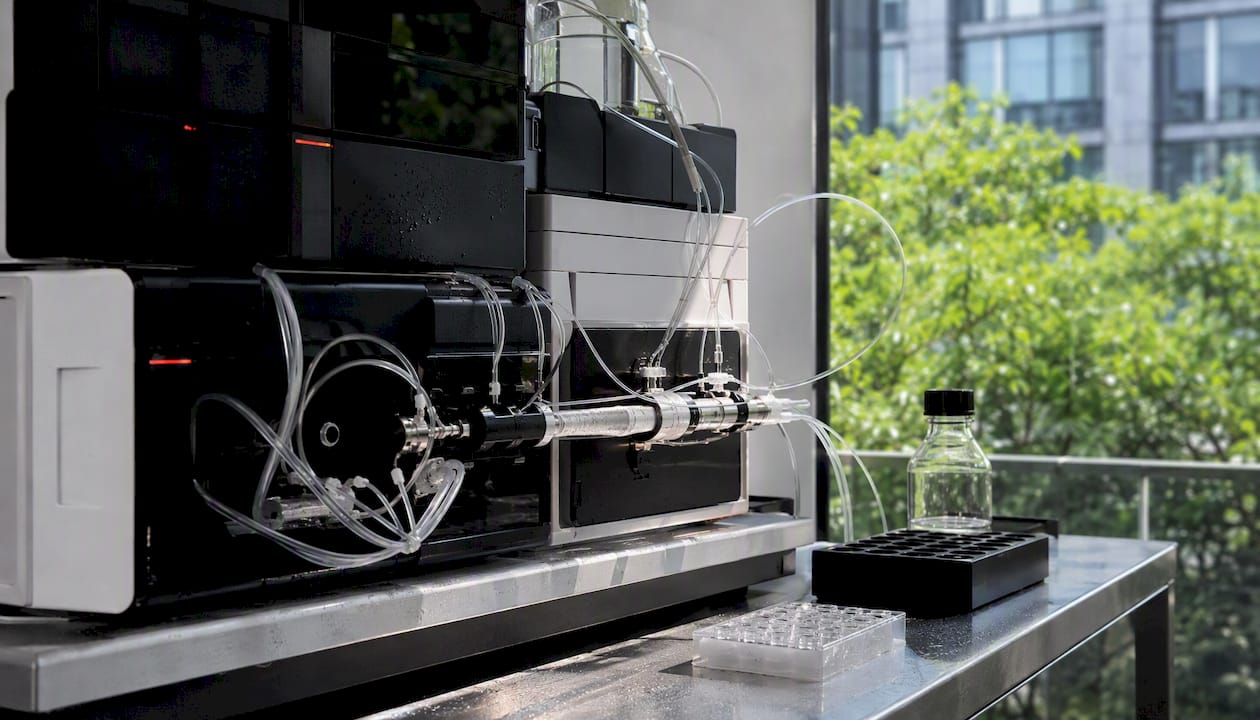
LC-MS becomes necessary when you need to identify unknown degradants, confirm molecular formulas, or meet the identification thresholds in ICH Q3A/Q3B. A single-quadrupole instrument handles most routine mass confirmation work; a high-resolution instrument (Q-TOF or Orbitrap) is required for accurate mass and fragmentation-based structural elucidation. For alkaloid-class molecules with complex degradation chemistry, such as those studied using 7-hydroxymitragynine reference materials, LC-MS is often the only practical path to confident degradant identification.
GC is appropriate for volatile APIs, residual solvents, or degradants that are not amenable to reversed-phase LC. It is rarely the primary SIM for non-volatile drug substances but is frequently used as an orthogonal check.
Capillary electrophoresis (CE) offers an orthogonal separation mechanism useful for chiral separations or highly polar APIs that perform poorly on reversed-phase columns. It is not commonly used as the primary SIM but can provide confirmatory specificity data.
Pro Tip: Run your stressed samples on both HPLC-DAD and LC-MS in parallel during early method development. The DAD data guides chromatographic optimization; the MS data builds your degradant library before you commit to a final method. Doing both early avoids a costly late-stage identification exercise.
The decision between these techniques comes down to four practical criteria: molecular weight and polarity (which drives column and mobile-phase choice), UV chromophore presence (which determines whether DAD is sufficient or fluorescence/MS detection is needed), the expected number and polarity range of degradants, and the LOQ required by your impurity reporting thresholds.
How to develop a chromatographic method that is genuinely stability indicating
Chromatographic method development for a SIM follows a logical sequence. Skipping steps early creates rework later, particularly when stressed samples reveal co-eluting peaks that a clean-sample method never exposed.
Development checklist
Column screening. Start with three to four column chemistries: C18 (standard and phenyl-hexyl), C8, and a polar-embedded phase. Run the unstressed API and a pooled stressed sample on each. The column that gives the best resolution of degradants from the API moves forward.
Mobile-phase pH. Test at pH 2.5–3.0 (acidic, suppresses ionization of basic APIs), pH 6.0–7.0 (near-neutral), and pH 9.0–10.0 if the API is stable at high pH. pH strongly affects retention and selectivity for ionizable molecules.
Organic modifier. Acetonitrile gives sharper peaks and lower UV background than methanol for most APIs. Methanol can improve selectivity for certain polar degradants.
Gradient vs. isocratic. Use gradient elution when degradants span a wide polarity range. Isocratic conditions are preferred for simpler matrices and when transfer to QC labs is a priority.
Temperature and flow. A column temperature of 30–40°C improves peak shape and reproducibility. Flow rate optimization follows column particle size: 1.7 µm particles (UPLC) typically run at 0.3–0.5 mL/min; 3.5–5 µm particles at 1.0–1.5 mL/min.
Peak-purity verification. After each chromatographic change, run the stressed samples and check peak purity using the DAD spectral correlation algorithm. A purity angle below the purity threshold confirms the API peak is homogeneous. Resolving the API peak from all degradants and confirming peak homogeneity is the primary evidence that a method is stability indicating.
System suitability criteria for SIMs
System suitability tests for a SIM go beyond the standard plate count and tailing factor. Set acceptance limits that are specific to the separation you have developed:
Resolution (Rs) ≥ 2.0 between the API and the nearest eluting degradant (or known impurity).
Tailing factor ≤ 2.0 for the API peak.
Theoretical plates ≥ 2,000 for the API peak (column-dependent; set based on your validated method).
Retention time reproducibility: RSD ≤ 1.0% across six injections of the system suitability standard.
Peak-purity angle below purity threshold for the API in the system suitability standard spiked with degradants.
Document the system suitability standard composition (API plus the most critical degradants at their specification limits) and the acceptance criteria in the method document before validation begins.
Validation experiments that prove a method is stability indicating
ICH Q2(R2) defines the validation characteristics required for a stability-indicating assay method. The table below maps each characteristic to its practical acceptance criterion and the experiment that generates the data.
Validation characteristic | Typical acceptance criterion | Key experiment |
Specificity/selectivity | No interference from degradants, excipients, or placebo; peak purity passes | Inject stressed samples, placebo, and blank; confirm peak purity by DAD |
Linearity | High linearity across a broad concentration range | Six to eight concentration levels; linear regression |
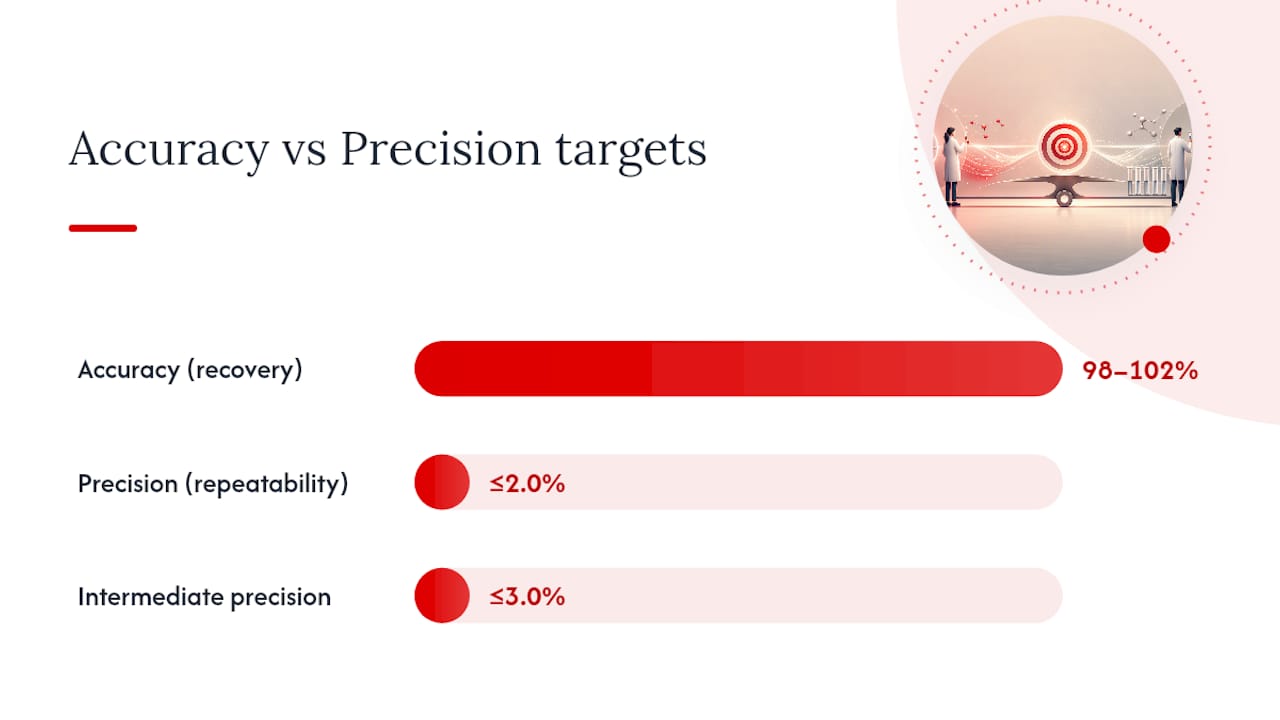
Accuracy (recovery) | 98.0–102.0% at three concentration levels | Spiked placebo at various concentration levels around nominal |
Precision (repeatability) | RSD ≤ 2.0% (six injections at 100%) | Six independent preparations at nominal concentration |
Intermediate precision | RSD ≤ 3.0% (two analysts, two days) | Replicate the repeatability experiment on a second day/analyst |
LOQ | S/N ≥ 10; RSD ≤ 10% at LOQ | Serial dilution from nominal; confirm with precision at LOQ |
LOD | S/N ≥ 3 | Serial dilution; confirm visually and by signal-to-noise |
Range | Covers nominal concentration and expected degradation range | Derived from linearity and accuracy data |
Robustness | Method performs within acceptance criteria under small deliberate changes | Vary pH ±0.2, flow ±10%, column temperature ±5°C, column lot |
Specificity is the defining validation characteristic for a SIM. The experiment design must include injections of each stressed sample (from every stress condition in your degradation matrix), the placebo stressed under the same conditions, and the unstressed API. Peak-purity data from the DAD, combined with the chromatographic resolution data, constitute the specificity evidence package.
For degradants that cannot be resolved by UV alone, LC-MS confirmation is required. When a degradant exceeds the identification threshold in ICH Q3A (0.10% for drug substances with a maximum daily dose ≤ 2 g) or Q3B, you must provide a structural proposal supported by mass spectral data.
Pro Tip: Run your specificity experiment before you finalize any other validation parameter. If the method fails peak-purity checks on stressed samples, every other validation dataset is built on an unstable foundation. Fix the chromatography first.
FDA’s analytical procedures validation guidance also expects a documented robustness study, typically using a Plackett-Burman or fractional factorial design to evaluate five to eight method parameters simultaneously. Robustness data belong in the validation report and are referenced in the method document as the basis for the system suitability limits.
How to evaluate stability data and assign a shelf life using ICH Q1E
The statistical workflow for shelf-life assignment under ICH Q1E is regression-based and conservative by design. The goal is to find the time point at which the 95% confidence interval of the regression line crosses the acceptance criterion (typically 90% of label claim for assay, or the degradant specification limit).
Compile and check the dataset. Collect assay and degradant data from all stability time points. Check for outliers using Grubbs’ test or Dixon’s Q test. Confirm that the data are approximately normally distributed at each time point.
Select the regression model. For most small-molecule APIs, a linear regression of assay (or degradant) vs. time is appropriate. If the data show curvature, a quadratic model may be justified, but document the rationale.
Test for poolability across batches. Run ANCOVA with time × batch as the interaction term. A p-value < 0.05 for the time × batch interaction indicates that the batches degrade at different rates and cannot be pooled. Overlooking this interaction is a common mistake: pool only when the interaction is not significant.
Calculate the 95% confidence interval. Fit the regression line to the pooled (or individual) batch data and compute the one-sided 95% confidence limit on the predicted mean. The shelf life is the time at which this lower confidence limit intersects the acceptance criterion.
Handle nonpoolable batches conservatively. When batches cannot be pooled, calculate the shelf life for each batch individually and use the shortest result, or apply a tolerance interval approach as a conservative alternative.
Report the calculation. The stability report must include the regression plot with confidence bands, the ANCOVA output, the poolability decision, and the calculated shelf-life value with its statistical basis. Reviewers expect to see the raw data table alongside the regression output.
For early-stage work with limited time points, focus on degradation rate estimation rather than a formal confidence-limit calculation. Phase III submissions and NDA/ANDA filings require the full 95% confidence-limit approach without exception.
A worked example: from stress matrix to validated method and regulatory report
This example describes a realistic development sequence for a small-molecule API with moderate UV absorption and known susceptibility to oxidation and base hydrolysis.
Week 1–2: Preparation and stress matrix execution. Prepare a 1 mg/mL stock solution of the API in the intended formulation solvent. Run all seven stress conditions simultaneously where possible, with 24-hour and 72-hour time points for solution conditions and 1-week and 2-week time points for solid-state conditions. Analyze each stressed sample by HPLC-DAD immediately after preparation to prevent secondary degradation.
Week 3: Analytical screening and peak assignment. Inject all stressed samples on three candidate columns. Identify the column and mobile-phase combination that resolves the greatest number of degradant peaks from the API. Run the two most degraded samples (oxidation and base hydrolysis) on LC-MS to assign tentative molecular formulas to unknown peaks.
Week 4–5: Method optimization. Refine gradient conditions, pH, and column temperature to achieve Rs ≥ 2.0 for all critical pairs. Confirm peak purity on the most degraded samples. Set the system suitability standard composition and acceptance limits.
Week 6–8: Validation runs. Execute specificity, linearity, accuracy, precision, intermediate precision, LOQ/LOD, range, and robustness experiments per the validation protocol. Run each experiment in the order listed; specificity first, robustness last.
Week 9 onward: Stability sample testing and statistical analysis. Transfer the validated method to the stability testing laboratory. Analyze samples at each scheduled time point. After accumulating at least three time points across at least three batches, run the ICH Q1E regression and poolability analysis.
Pro Tip: Schedule the LC-MS identification runs during the same week as chromatographic screening, not after method finalization. Structural data from that early stage often reveals a degradant pair that requires a pH or gradient change you would otherwise discover only during validation — a correction that costs days, not weeks, when caught early.
Deliverables for the regulatory dossier
Forced-degradation study report (stress conditions, chromatograms, mass balance table, degradant list)
Method development report (column screening data, rationale for final conditions)
Validation protocol and validation report (all ICH Q2(R2) characteristics, raw data, acceptance criteria)
LC-MS degradant identification report (mass spectra, proposed structures, ICH Q3A/B classification)
Stability data summary with ICH Q1E regression output and shelf-life calculation
Common failures in SIM development and how to fix them
Even well-planned SIM projects encounter predictable problems. Recognizing the red flags early prevents them from becoming validation failures.
Red flags that indicate a method is not stability indicating
Peak purity fails on stressed samples. The purity angle exceeds the purity threshold for the API peak, meaning a degradant is co-eluting. This is the most critical failure mode.
Mass balance is outside the acceptable range. Industry guidance classifies mass balance deviations above 5% as high risk requiring remediation. A deviation of 2–5% is moderate risk; below 2% is low risk. Poor mass balance usually means a degradant is not being detected or is eluting outside the integration window.
Degradant peaks are absent from stressed samples. If a stress condition produces no detectable degradants, either the stress was insufficient or the degradants are not UV-active. Increase stress severity or switch to MS detection.
System suitability fails on stability samples. Resolution between the API and a degradant drops below 2.0 as degradant concentration increases. This indicates the method was developed at too low a degradant concentration.
Retention time drift across stability time points. Column aging or mobile-phase variability. Implement a reference standard injection at the start of each sequence and set a retention time window in the system suitability criteria.
Corrective actions
Co-eluting degradant: change mobile-phase pH by ±0.5 units, switch to a phenyl-hexyl or polar-embedded column, or add an ion-pairing reagent for charged degradants.
Poor mass balance: extend the gradient to elute late-eluting degradants, check for degradant adsorption to the column or vial, and run an LC-MS total-ion chromatogram to find UV-invisible peaks.
Insufficient degradation: increase reagent concentration, temperature, or exposure time. For photolysis, verify lamp output with a calibrated radiometer.
Legacy method remediation: if a method in routine use has never been challenged with stressed samples, run a retrospective stress study. If peak-purity data cannot be generated (no DAD available), use an orthogonal method (CE or a different column chemistry) to confirm specificity. Document the risk assessment and remediation plan in the method file.
For sample preparation decisions that affect physical integrity of the sample before analysis, confirm that dissolution and filtration steps do not introduce artifactual degradation. Filtration through certain membrane types can adsorb API or degrade labile compounds; always run a filter validation as part of sample prep development.
A practitioner’s perspective on what actually matters in SIM development
The regulatory framework for SIMs is well-defined, but the practical execution is where projects succeed or fail. After working through the ICH guidance documents and the validation literature, a few priorities stand out as consistently underweighted in early-stage development.
Forced degradation documentation is the single most important deliverable in the entire SIM package. Reviewers and auditors return to it repeatedly: it is the evidence base for specificity, the source of your degradant library, and the justification for your system suitability criteria. Invest the time to run it thoroughly and document it completely before moving to method optimization.
Peak-purity verification deserves more attention than it typically receives in early development. Many teams run peak-purity checks only during validation, but the DAD data from the stress study should be reviewed at every chromatographic screening stage. A co-eluting degradant discovered during validation requires a method change; the same discovery during screening costs an afternoon.
LC-MS is not optional for complex molecules or for any degradant that exceeds the ICH Q3A/B identification threshold. The structural data it provides are required in the dossier, and the earlier you generate them, the more they inform your chromatographic choices.
Practical advice worth keeping close:
Engage your formulation colleagues before the stress study, not after. They know which excipients are reactive and which degradation pathways are chemically plausible for your molecule.
Run the robustness study with real column-to-column and lot-to-lot variability, not just deliberate parameter changes. A method that passes a Plackett-Burman design but fails on a different column lot is not robust.
For reference material traceability, consult your reference material documentation early. Calibration uncertainty propagates into every quantitative result in the validation package.
When the timeline is compressed, prioritize specificity and accuracy data. Precision and robustness can follow, but a method without demonstrated specificity cannot be used for any regulatory purpose.
Sources
The following primary guidance documents and review articles are the core references for SIM development and validation. Download and cite them directly in your protocol and dossier.
ICH Q1A (R2): Stability testing of new drug substances and drug products - Scientific guideline
Current practices and considerations for a stability‑indicating method in pharmaceutical analysis
FDA: ANDAs - Stability testing of drug substances and products (Questions and answers)
Strength and stability testing for compounded preparations (USP compounding expert committee)
This article is general information, not a substitute for advice from a qualified doctor. Consult a qualified healthcare professional about your own circumstances before acting on anything here.
FAQ
What are stability indicating parameters?
Stability-indicating parameters are the analytical characteristics a method must demonstrate to confirm it accurately measures API degradation without interference: specificity (separation of API from all degradants), accuracy, precision, linearity, LOQ/LOD, range, and robustness, as defined in ICH Q2(R2). Peak-purity data from forced-degradation samples is the primary evidence for specificity.
What are the different methods of stability testing?
Stability testing methods include real-time stability studies (storage at intended conditions over the full shelf-life period), accelerated stability studies (elevated temperature and humidity to predict degradation rate), and forced degradation or stress testing (deliberate chemical breakdown under heat, humidity, oxidation, photolysis, and pH extremes to identify degradants and validate SIM specificity), all governed by ICH Q1A(R2).
What is the purpose of a stability indicating method per ICH?
ICH requires a SIM to accurately and precisely measure API concentration over time, free from interference by degradation products, excipients, or process impurities, so that any measured potency loss reflects genuine chemical degradation rather than analytical artifact. The method supports shelf-life assignment, impurity reporting, and release testing across the product lifecycle.
When is LC-MS required instead of HPLC-DAD alone?
LC-MS is required when a degradant exceeds the identification threshold in ICH Q3A (0.10% for drug substances with a maximum daily dose ≤ 2 g) or Q3B, when a degradant lacks a UV chromophore, or when DAD peak-purity data alone cannot confirm the absence of co-eluting impurities. It is also the practical standard for alkaloid-class molecules with complex degradation chemistry.
How is shelf life calculated from stability data?
Per ICH Q1E, shelf life is the time at which the one-sided 95% confidence limit of the regression line (assay or degradant vs. time) intersects the acceptance criterion. Before pooling data across batches, test for poolability using ANCOVA; a significant time × batch interaction (p < 0.05) requires batch-specific shelf-life calculations rather than a pooled estimate.
Recommended
Comments