
LOD and LOQ in Analytical Chemistry: A Lab Guide
- 7OHyea
- Aug 8
- 12 min read


The limit of detection (LOD) is the lowest analyte concentration that can be reliably distinguished from a blank signal; the limit of quantitation (LOQ) is the lowest concentration that can be measured with predefined accuracy and precision. LOQ is always greater than or equal to LOD, and both values are method- and matrix-specific, not instrument properties you can borrow from a vendor datasheet.
The two most commonly applied formula sets are:
Blank/LoB-based approach:
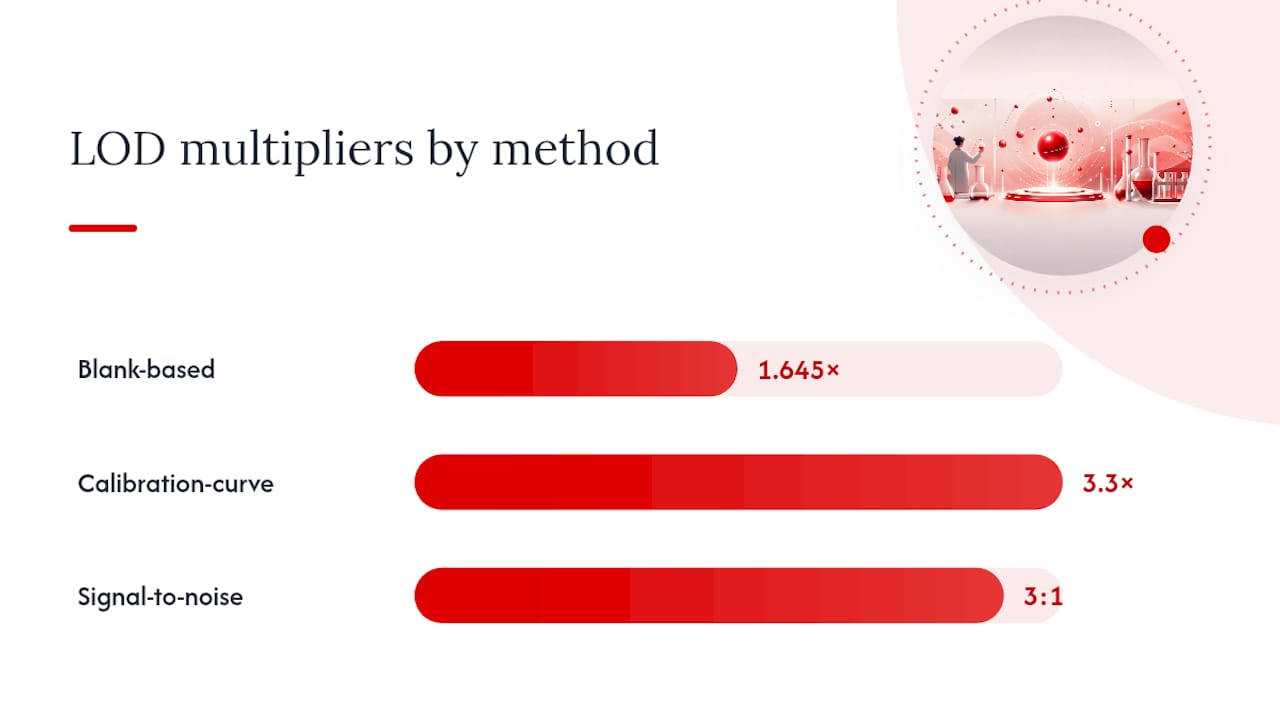
LoB = mean(blank) + 1.645 × SD(blank)
LoD = LoB + 1.645 × SD(low-concentration sample)
LoQ = concentration where %CV and bias meet predefined criteria
Calibration-curve (regression) approach:
LOD = 3.3 × σ / slope
LOQ = 10 × σ / slope (where σ is the standard deviation of residuals from the calibration fit)
Signal-to-noise (S/N) approach:
LOD: S/N ≥ 3:1
LOQ: S/N ≥ 10:1
When to use each:
Blank/LoB method: best for immunoassays, clinical chemistry, and methods where you can collect 20–60 blank replicates and low-level sample replicates
Calibration-curve method: standard for chromatographic methods (HPLC, GC, LC-MS) where a linear regression is already part of the method
S/N method: convenient for chromatographic screening but requires experimental verification before regulatory submission
Pro Tip: If your method is intended for quantitative reporting rather than a simple pass/fail limit test, the calibration-curve or blank-based approach will produce a more defensible LOQ than S/N alone.
Key Takeaways
LOD and LOQ are method- and matrix-specific values that must be calculated, verified experimentally, and documented with full traceability to withstand regulatory scrutiny.
Point | Details |
Choose the right method | Use calibration-curve (LOD = 3.3 × σ / slope) for quantitative chromatographic methods; use blank-based for limit tests and immunoassays. |
Verify experimentally | Run precision and trueness studies at the LOQ across at least three days; accept only if %CV ≤ 20% and recovery is within ±20%. |
Address matrix effects | Always use matrix-matched blanks and spikes; solvent-based calibration alone will produce an LOD/LOQ that does not reflect real sample performance. |
Document multipliers | State which multipliers you used (1.645, 3.3, 10, or S/N thresholds) and cite the guidance document; unexplained multiplier choices are a common audit finding. |
Archive reference material records | Record supplier, lot number, purity, and CoA for every standard used; a missing CoA can invalidate the entire validation dataset. |
Table of Contents
What do LoB, LoD, and LoQ actually mean statistically?
Armbruster and Pry (2008) provide the clearest published framework for distinguishing these three terms, and their definitions have become the standard reference in clinical and analytical chemistry.
Limit of Blank (LoB): The highest signal value likely to be observed when measuring a blank sample containing no analyte. Statistically, it represents the 95th percentile of blank measurements: LoB = mean(blank) + 1.645 × SD(blank). The multiplier 1.645 corresponds to a one-sided 95% confidence interval on a normal distribution.
Limit of Detection (LoD): The lowest analyte concentration at which the measured signal exceeds the LoB with a specified probability, typically 95%. The formula is: LoD = LoB + 1.645 × SD(low-concentration sample). This means a true positive result at the LoD will be correctly identified 95% of the time, while a blank will be misidentified as positive no more than 5% of the time.
Limit of Quantitation (LoQ): The lowest concentration at which the method meets predefined criteria for both precision (imprecision) and trueness (bias). Unlike LoD, LoQ is not derived from a single statistical multiplier; it is determined experimentally by testing whether %CV and recovery fall within acceptable bounds at candidate concentrations.
The relationship LoB < LoD ≤ LoQ holds in virtually all practical cases. When the method’s total error at the LoD already satisfies the predefined acceptance criteria, LoQ can equal LoD, though in practice LoQ is usually higher after multi-day precision and trueness verification.
Term | Statistical basis | Typical multiplier | What it answers |
LoB | 95th percentile of blank distribution | 1.645 × SD(blank) | What is the highest blank signal? |
LoD | LoB + 95% detection probability | 1.645 × SD(low sample) | Can the analyte be detected? |
LoQ | Precision + trueness criteria met | Method-specific | Can the analyte be reliably quantified? |
For establishing LoB and LoD, Armbruster and Pry recommend replicate counts consistent with standard guidelines for full establishment and verification studies. These counts apply across multiple reagent lots and instruments when the method will be used in a regulated environment.
How do the three main calculation methods compare?
Choosing the wrong calculation approach is one of the most common sources of audit findings in method validation. The blank-based, calibration-curve, and signal-to-noise methods each have distinct data requirements and assumptions.
Blank-based (LoB → LoD → LoQ) workflow
This approach requires a set of blank replicates and a set of low-concentration sample replicates, both measured under repeatability conditions. The BioPharm International guidance confirms the LoB formula as mean(blank) + 1.645 × SD(blank), with LoD then derived by adding 1.645 × SD of the low-level sample to that LoB. The method assumes normally distributed blank signals and requires that the low-level sample concentration be close to the expected LoD, not orders of magnitude above it.
The European Commission guidance on LOD/LOQ for contaminants describes a simplified variant: LOD = 3 × SD(blank) and LOQ = 6× or 10× SD(blank), where the multipliers 3, 6, and 10 are approximations of the 1.645 + 1.645 logic rounded for practical use. The ratio between LOQ and LOD depends directly on which multiplier pair you select.
Calibration-curve (regression) approach
The regression method uses the standard deviation of residuals (σ, often called RMSE) from a fitted calibration curve and the slope of that curve. LCGC International describes the formulas as LOD = 3.3 × σ / slope and LOQ = 10 × σ / slope, where σ is extracted from the regression output. This approach is well-suited to chromatographic methods because the calibration curve is already a required validation element. The key assumption is homoscedasticity: if variance increases with concentration (heteroscedasticity), the residual SD will be inflated and the calculated LOD/LOQ will be pessimistic.
Signal-to-noise (S/N) approach
ICH Q2(R2)_Guideline_2023_1130.pdf) endorses S/N ratios of approximately 3:1 for detection and 10:1 for quantitation in chromatographic methods where baseline noise is measurable. The ACS experimental comparison study demonstrates that S/N rules are convenient but can oversimplify, particularly when noise is non-uniform across the chromatogram. S/N-based estimates should always be followed by empirical verification at the proposed limits.
Dimension | Blank-based | Calibration-curve | Signal-to-noise |
Best use case | Limit tests, immunoassays, clinical chemistry | Quantitative chromatographic methods | Chromatographic screening, preliminary estimates |
Required input data | 20–60 blank replicates + low-level sample replicates | Calibration standards, regression fit, residual SD | Baseline noise measurement, analyte peak height |
Key assumptions | Normal blank distribution, low-level sample near LoD | Homoscedasticity, linear range includes LoD/LoQ | Uniform baseline noise, stable instrument response |
Typical multipliers | 1.645 (LoB), 1.645 (LoD), method-specific (LoQ) | 3.3 (LOD), 10 (LOQ) | 3:1 (LOD), 10:1 (LOQ) |
Regulatory defensibility | High (Armbruster & Pry, CLSI EP17) | High (ICH Q2, LCGC) | Moderate (requires verification) |
Pro Tip: Match your calculation method to your validation category. A limit test (pass/fail) can rely on the blank-based approach with 20 verification replicates. A quantitative method submitted to the FDA or EPA needs the calibration-curve approach plus multi-day precision and trueness data at the calculated LOQ.
How do you calculate LOD and LOQ from a calibration curve?
The calibration-curve method is reproducible and spreadsheet-friendly. Here is a complete worked example you can adapt directly.
Step 1: Set up your data layout
Prepare a spreadsheet with three columns: Concentration (ng/mL), Instrument Response (peak area or absorbance), and Replicate ID. Use at least six concentration levels spanning your expected working range, with two to three replicates per level.
Example dataset (six levels, two replicates each):
Step 2: Fit the linear regression
In Excel or Google Sheets, use =LINEST(response_range, concentration_range, TRUE, TRUE) to extract slope, intercept, and residual standard error. The residual standard error (σ) is the standard deviation of the residuals, equivalent to RMSE.
From the example data: slope ≈ 1,516, σ (residual SD) ≈ 42.
Step 4: Verify empirically
Prepare matrix-matched samples at 0.091 ng/mL and 0.277 ng/mL. Measure six replicates on each of three separate days. At the LOQ, %CV should be ≤20% and recovery should fall within ±20% of the nominal value. At the LOD, confirm that the signal is consistently distinguishable from blank.
Prepare low-level matrix-matched spikes at the calculated LOD and LOQ
Run six replicates per day across three non-consecutive days
Calculate %CV and mean recovery for each day
Accept the LOQ if all days meet precision and trueness criteria
If any day fails, recalculate using the most conservative (highest) LOQ observed
Pro Tip: Keep the LINEST output and raw data in the same workbook tab as your validation summary. Auditors frequently request the underlying regression diagnostics, and having them one click away prevents delays.
How do you verify that your LOQ is fit for purpose?
Calculating an LOQ from a formula is only the first step. Regulatory reviewers and auditors expect experimental evidence that the method actually performs at that concentration.
Study design
Eurachem’s Fitness for Purpose guide recommends evaluating precision and trueness at low concentrations using matrix-matched samples across multiple days. A practical minimum is three days with six replicates per day at the LOQ level, giving 18 measurements. For a full establishment study, the Armbruster and Pry framework recommends 60 replicates; for verification of a previously established LOQ, 20 replicates across multiple days is the accepted minimum.
When do matrix effects and heteroscedasticity change your LOD and LOQ?
Matrix effects and non-uniform variance are the two most underestimated sources of error in LOD/LOQ determination, particularly in LC-MS and environmental methods.
Matrix effects
Ion suppression or enhancement in electrospray ionization can shift the effective slope of your calibration curve when solvent-based standards are used instead of matrix-matched ones. A calibration built in pure solvent will produce a different slope than one built in extracted matrix, and because LOD = 3.3 × σ / slope, an inflated slope from a solvent curve will artificially lower the calculated LOD. The actual detection capability in the real matrix will be worse. Guidance from Armbruster and Pry explicitly warns against adopting limits derived without matrix verification.
Always prepare blanks and low-level spikes in the same matrix as study samples
Use stable isotope-labeled internal standards where available to compensate for ion suppression
Report whether calibration was performed in solvent or matrix-matched media
Heteroscedasticity
When variance increases proportionally with concentration (a common pattern in LC-MS/MS), ordinary least-squares regression overweights the high-concentration points and inflates the residual SD. The result is an LOD/LOQ that is higher than necessary. The remedy is weighted regression, typically using 1/x or 1/x² weighting, which gives more influence to low-concentration points where detection and quantitation limits actually matter. LC-MS validation literature recommends plotting residuals versus concentration as a diagnostic step before accepting any regression-based LOD/LOQ.
Special cases: when LOD equals LOQ
When the method’s total error at the LoD already satisfies the predefined acceptance criteria for both precision and trueness, LoQ can equal LoD. This situation arises most often in methods with very low noise floors, such as high-sensitivity mass spectrometry, or in limit tests where the only required output is presence/absence. For analytes reported only as “detected” or “not detected,” a formal LOQ is not required, and the LoD alone defines the method’s capability.
Pro Tip: Before assuming LOD equals LOQ, run the full precision and trueness experiment at the LoD concentration. If %CV exceeds your acceptance criterion there, LOQ must be set higher, regardless of what the formula suggests.
How should you report LOD and LOQ in regulatory submissions?
Clear, reproducible reporting is what separates a validation report that passes review from one that generates a deficiency letter. U.S. regulatory agencies, including the FDA and EPA, expect the method, the calculation approach, and the verification data to be fully documented.
Authoritative documents to cite
Armbruster and Pry (2008), PMC: Peer-reviewed reference for LoB/LoD/LoQ definitions, formulas, and sample-size recommendations; widely cited in clinical and analytical chemistry
Eurachem Fitness for Purpose guide: Covers method validation broadly, with annexes on statistical detection limits and LOQ determination by precision/trueness testing
How do reference materials and traceability strengthen your LOD/LOQ data?
The quality of your LOD and LOQ determination is only as good as the reference materials used to generate it. Traceability and documentation of those materials are non-negotiable for regulatory submissions.
Types of reference materials
Certified reference materials (CRMs): materials with values assigned by an accredited body under ISO 17034; provide the highest level of traceability and are preferred for regulated methods
For alkaloid analysis, including 7-hydroxymitragynine and related compounds, laboratory detection methods require particular attention to matrix preparation because biological and environmental matrices can suppress or enhance ionization significantly.
Documentation requirements
Every reference material used in a validation study should be recorded with:
Supplier name and catalog number
Lot or batch number
Stated purity and expiration date
Certificate of Analysis (CoA) archived with the validation record
Preparation records for any in-house dilutions or spikes
Reference material traceability guidance provides a practical framework for documenting these elements in a format that satisfies both ISO 17025 and FDA expectations.
Preparing low-level spiked materials
Prepare spiked materials at concentrations bracketing the expected LOQ, typically at 0.5×, 1×, and 2× LOQ. Use volumetric glassware and calibrated balances, and document each preparation step. Vendor-provided standards are acceptable when the purity is certified; in-house preparations require an independent verification step, such as comparison against a second standard source.
Traceability is not a formality. When an auditor questions your LOQ, the first document they request is the CoA for the reference material used to generate it. A missing or expired CoA can invalidate an entire validation dataset, regardless of how well the statistics look.
Pro Tip: Link your LOQ monitoring QC samples to the same reference material lot used during validation. When you change lots, run a parallel comparison at the LOQ level before retiring the old material.
The mistakes labs keep making with LOD and LOQ
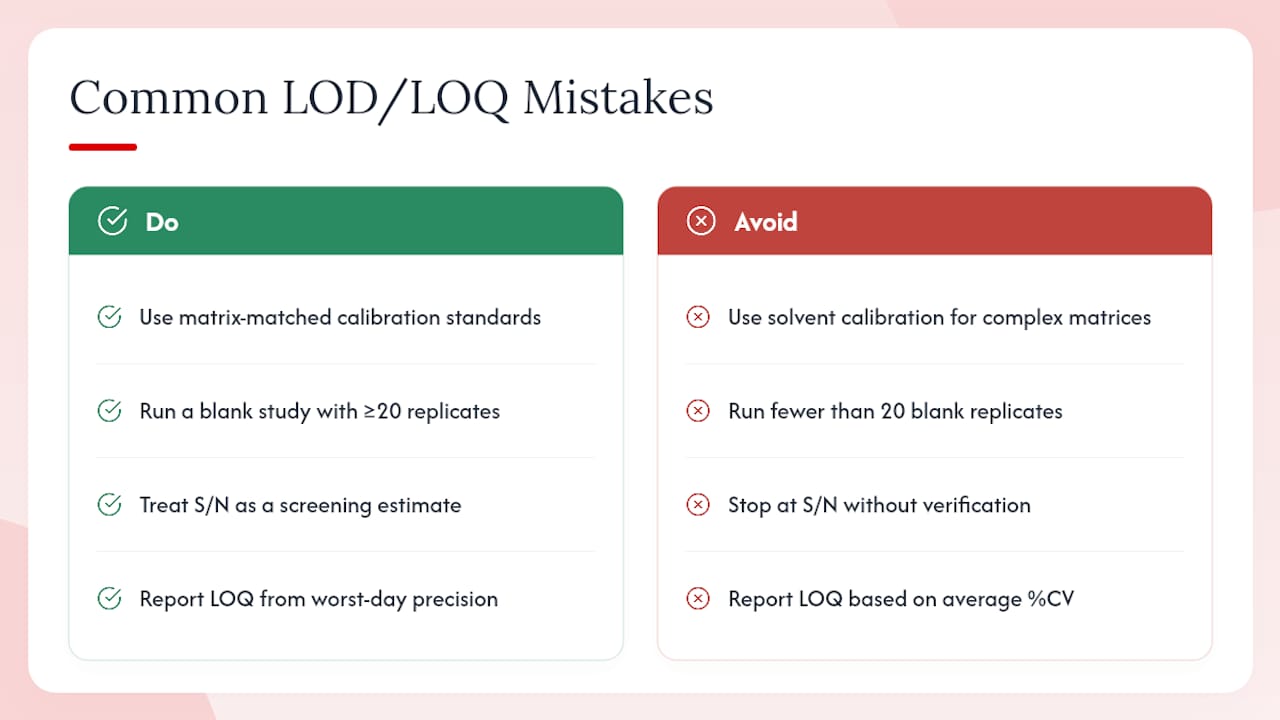
The most persistent error in LOD/LOQ determination is using solvent-based calibration standards to calculate limits that will be applied to complex matrices. It happens because solvent calibration is faster and cheaper, and the numbers look cleaner. But a slope derived from pure solvent does not represent the method’s behavior in plasma, urine, tissue extract, or environmental water, and the LOD/LOQ calculated from it is not the LOD/LOQ the method actually achieves.
The second most common problem is underpowering the blank study. Twenty replicates is the minimum for a verification study; fewer than that and the SD estimate is unstable enough to shift the LoB by a meaningful margin. Labs running eight or ten blanks and reporting a LoB as if it were fully established are producing numbers that will not survive scrutiny.
S/N-based LOQ is convenient, and ICH Q2(R2) permits it for chromatographic methods. The problem is that many labs stop there. S/N gives you a starting point, not a finished answer. The ACS experimental comparison shows that S/N estimates and regression-based estimates can diverge substantially for the same method, and S/N ignores cross-day variance entirely. If your method will be used in a regulated context, treat S/N as a screening estimate and follow it with a precision and trueness study.
Conservative reporting is not pessimism. When your three-day LOQ verification produces %CVs of 12%, 18%, and 22%, the reportable LOQ is the one that corresponds to the 22% day, not the average. That is the number that tells you where the method reliably performs, and it is the number that protects your laboratory when a result near the LOQ is challenged.
Authoritative references and further reading
The sources below are the primary documents you should download, archive in your validation records, and cite in regulatory submissions.
Document | Publisher | Topics covered |
PMC / AACC | LoB/LoD/LoQ definitions, formulas, sample-size recommendations, when LoQ = LoD | |
Eurachem | Method validation broadly, LOQ by precision/trueness, matrix-matched testing | |
LCGC International | Calibration-curve LOD/LOQ formulas, regression diagnostics, verification | |
ACS Analytical Chemistry | Experimental comparison of S/N, blank, and regression methods for HPLC | |
European Commission | Blank-based multipliers (3, 6, 10), LOQ/LOD ratios, food/feed context | |
University of Tartu | Multi-day LOQ design, conservative reporting, heteroscedasticity diagnostics | |
BioPharm International | LoB formula, blank-based approach, S/N and regression comparison |
Key actions for your validation records:
Download and archive the PDF of each document at the time of use; guidance documents are updated and older versions should be retained with the validation file
Cite the specific section or equation number, not just the document title, so reviewers can locate the basis for your calculation
For U.S. pharmaceutical submissions, ICH Q2(R2) and CLSI EP17 are the primary references; for environmental methods, EPA Method guidance documents take precedence
FAQ
What is LOD and LOQ?
LOD (limit of detection) is the lowest analyte concentration reliably distinguished from a blank signal; LOQ (limit of quantitation) is the lowest concentration measured with acceptable precision and trueness. LOQ is always greater than or equal to LOD.
How do you calculate LOD and LOQ in method validation?
The calibration-curve method uses LOD = 3.3 × σ / slope and LOQ = 10 × σ / slope, where σ is the residual standard deviation from the regression fit. The blank-based method uses LoB = mean(blank) + 1.645 × SD(blank) as the starting point, with LoD and LoQ derived from low-level sample replicates.
What does LOQ mean in lab results?
LOQ is the lowest concentration at which the method can produce a quantitative result meeting predefined criteria for both precision (%CV) and trueness (recovery). Results below the LOQ are typically reported as “less than LOQ” rather than as a numeric value.
Can LOD and LOQ be the same value?
Yes, when the method’s precision and trueness at the LoD already satisfy the predefined acceptance criteria, LoQ can equal LoD. This is more common in high-sensitivity methods or limit tests, but it must be confirmed experimentally, not assumed from the formula alone.
Which regulatory guidance covers LOD and LOQ for pharmaceutical methods?
ICH Q2(R2) is the primary guidance for pharmaceutical analytical method validation in the U.S. and internationally. CLSI EP17 covers detection capability for clinical laboratory methods, and Eurachem’s Fitness for Purpose guide provides broader method validation context including LOQ determination by precision and trueness testing.
Recommended
Comments